Creating Tables and Graphs of Ratios
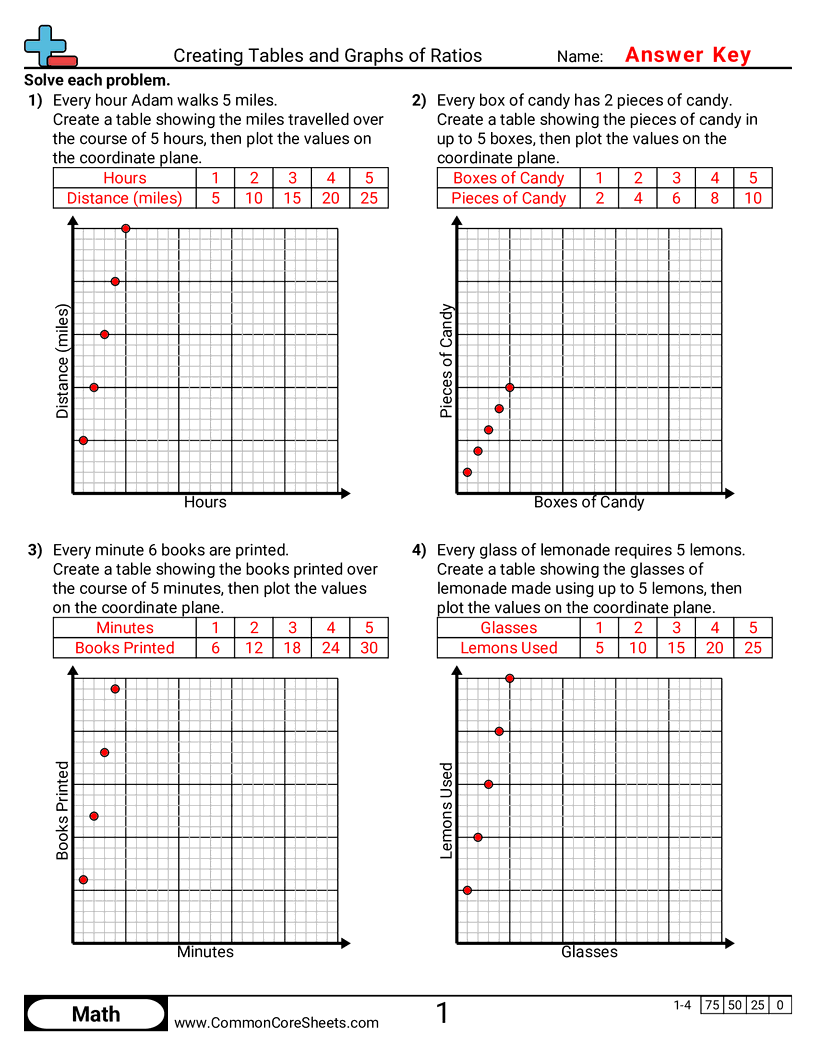
Each worksheet has 4 problems creating a table and graph from a scenario.
Student Objectives
- Turn a real-world ratio situation into a table of matching values.
- Plot ratio pairs as points on a coordinate plane.
- Use the graph to see and describe the proportional relationship.
Tags
Standards