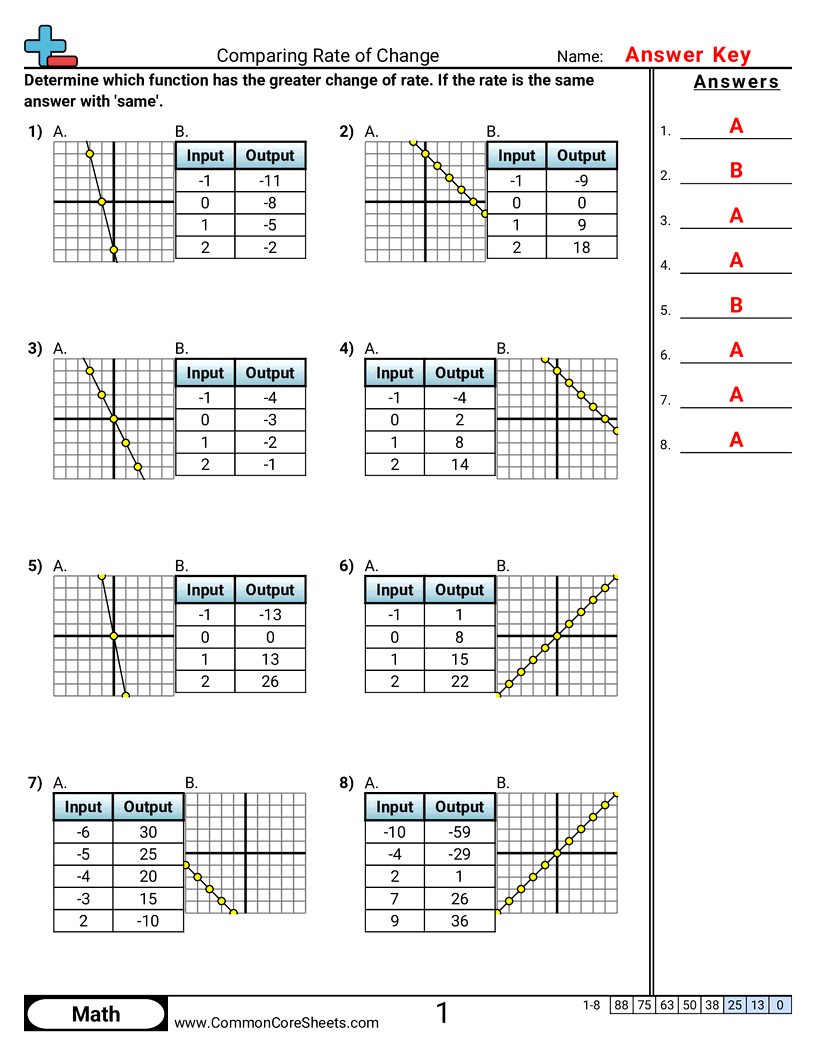
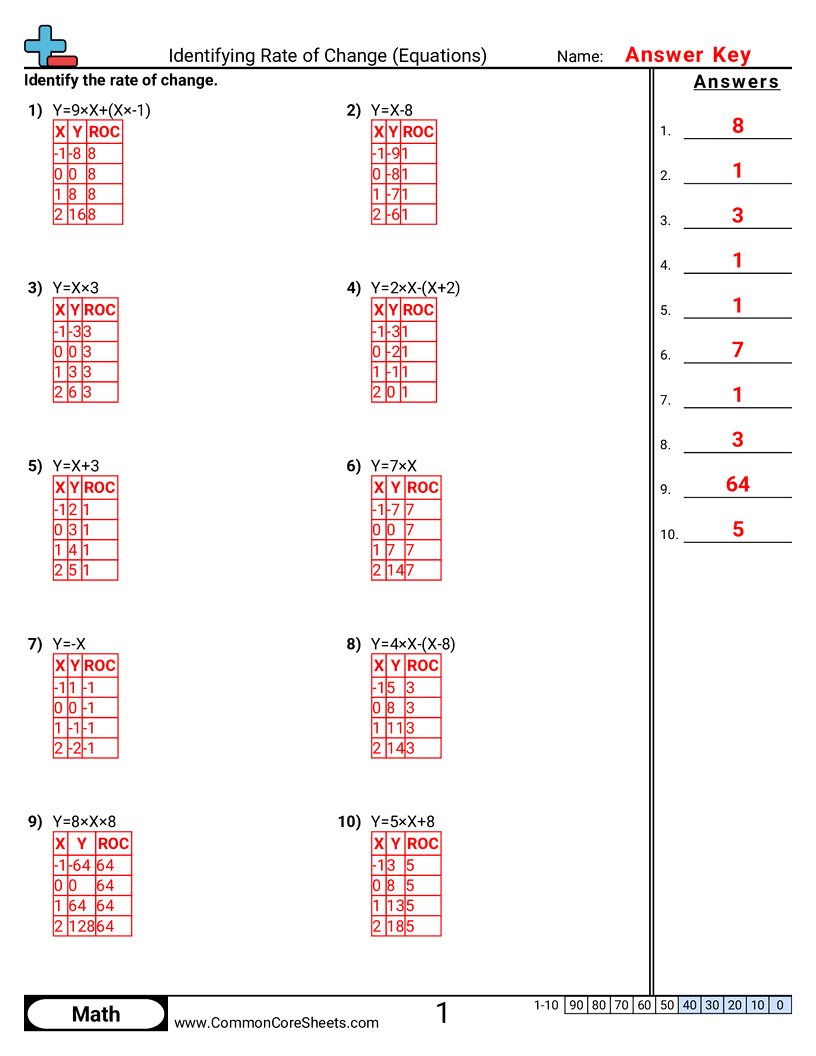
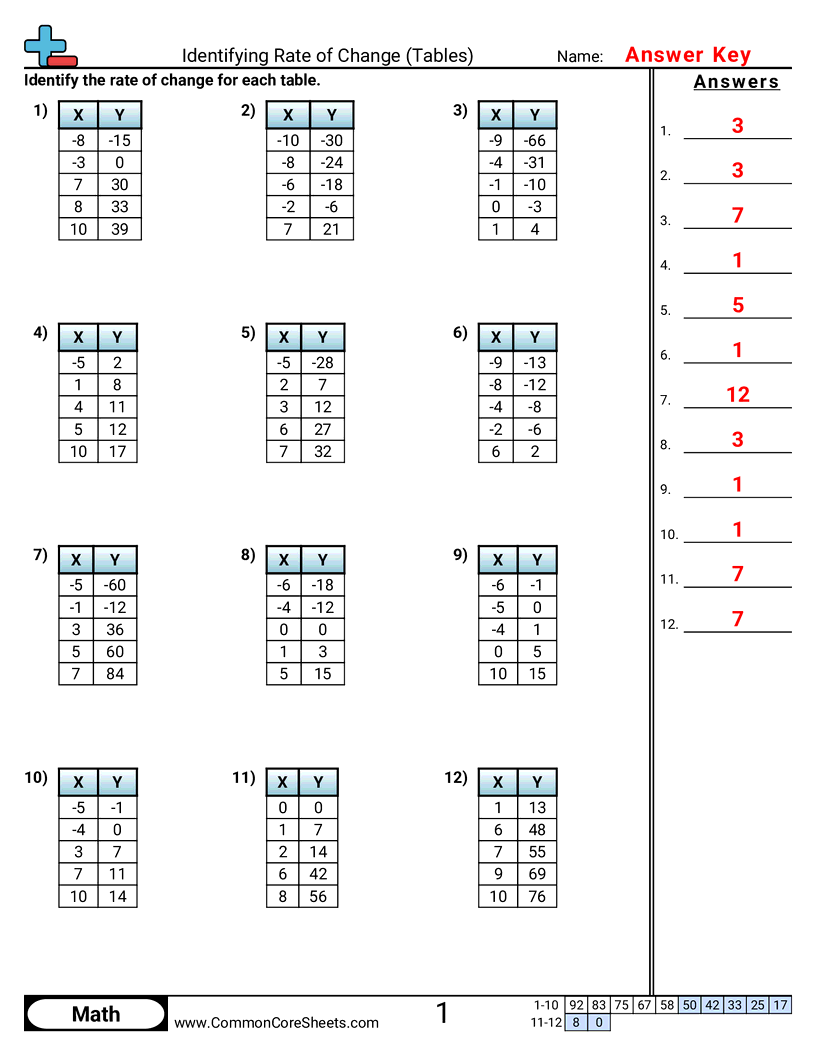
Identifying Rate of Change (Graphs)
Each worksheet has 6 problems identifying the rate of change using information on a graph.
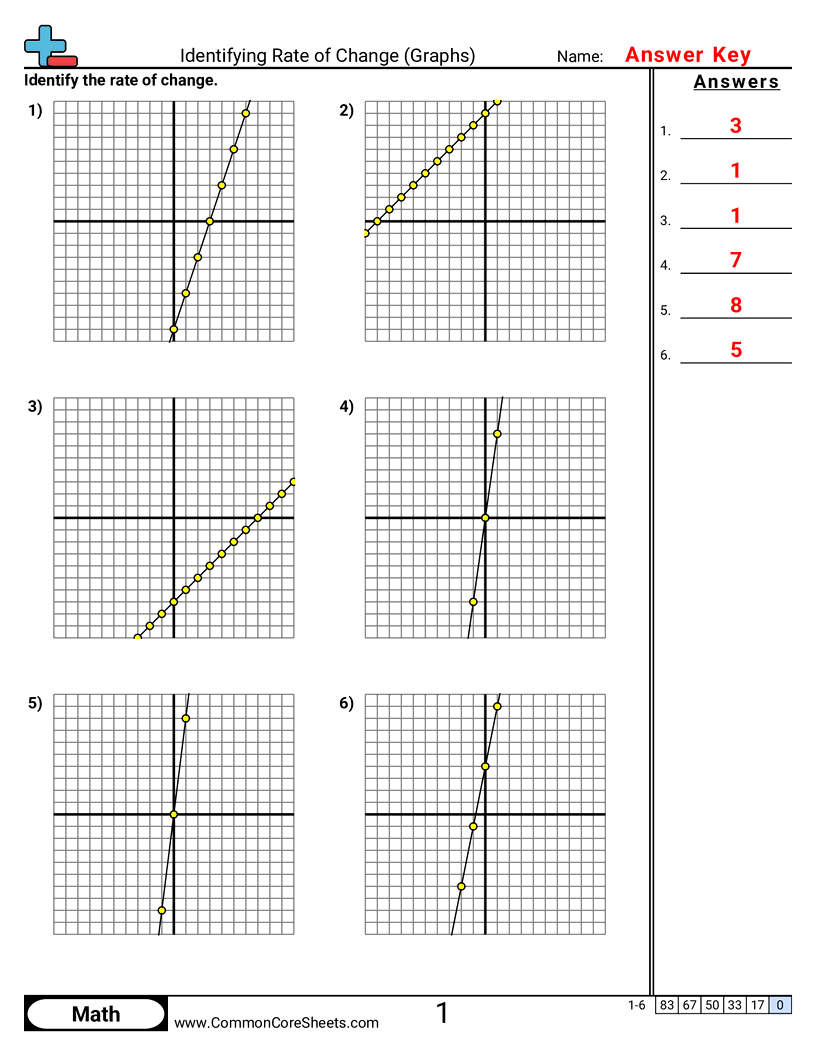
Student Objectives
- Read points from a graph and use them to find how much y changes when x changes.
- Find the rate of change by counting the rise and run between two points on a line.
- Tell whether a line shows a positive, negative, or zero rate of change.
Tags
Standards